


Stay Long Weekend: Full Tank
Just Stay Long

Welcome, subscribers! We have a post scheduled for Monday with 3 interesting ideas we found in recent investment letters. Until then, we’ll tide you over with our latest Stay Long Weekend, where we share the best stock pitches we come across from other investing newsletters. This week, we’re happy to share pitches for a global payments company and a contract drug manufacturer. Read on to learn more. 📕👇
If our work has been helpful, please forward to a friend or colleague. 🙏
Disclaimer: Nothing here constitutes professional and/or financial advice. You alone assume any risk with the use of any information contained herein. We may own positions in the securities listed. Please do your own due diligence.
To the investment managers who read this, you can send us your letters at elevatorpitches@substack.com or on Twitter (and Threads!) if you’d like to be included in a future issue.
Let’s get to it.
Iceman Capital just published a long and detailed pitch for Fleetcor Technologies (FLT). With the overhang of an FTC case against them recently removed (case closed June 2023), will investors take a fresh look at the company? We particularly enjoyed Iceman’s Payments Market Overview, which we include below. We encourage you to click through and read their entire post.
Business-to-Business (B2B) Payments Market Overview
Before we get into a detailed description of payments, I think starting the conversation with how a typical consumer-to-business payment works makes sense. In Exhibit C, we can walk through the major steps needed to complete a transaction—initially, the cardholder swipes/taps at a merchant’s point of sale terminal. The merchant then sends a clearance request to its acquiring bank, which is passed onto the network and eventually to the card issuing bank. The issuing bank then approves or rejects this transaction through the network. The card network will finalize the calculations (including tip or finalized amount) and enable the issuing bank to pay the acquiring bank/merchant. What the consumer sees is effectively an instantaneous transaction, but in reality, it takes a few days if you include the settlement period.
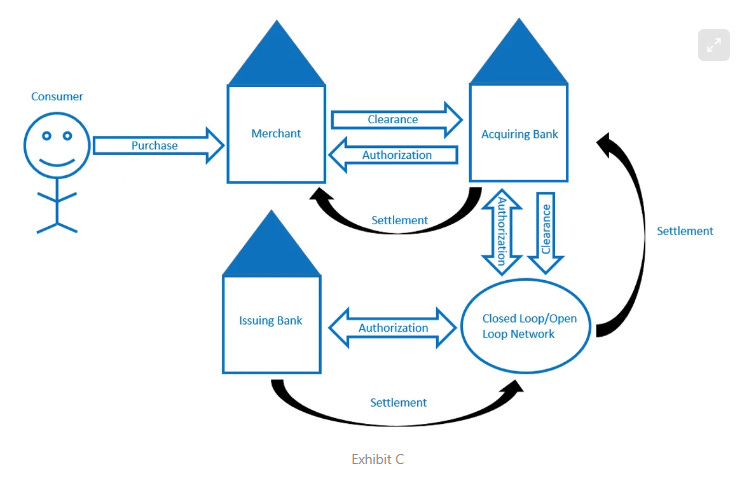
Exhibit D provides an illustration of how a typical B2B transaction occurs. Employees will initially identify a product or service they want to purchase and seek manager approval to complete that transaction. After getting approval, a purchase order is sent to the supplier. Once the purchase order is processed or fulfilled, the accounts receivable department of the supplier will send an invoice to the customer. The customer’s accounts payable department will then review & reconcile the final invoice with documentation from the supplier’s accounts receivable department. If approved, the AP department processes the invoice, and a payment is made to the supplier’s bank. A B2B transaction can easily take 30 to 90 days to complete, substantially longer than a typical C2B transaction which is usually ~2 days. In general, there are many more touch points in the B2B space due to the required checks & balances involved with what are usually large transactions.

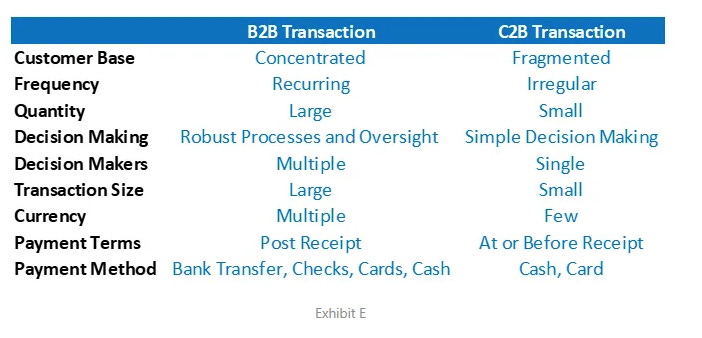
Exhibit F provides a simple comparison of how transactions between these two categories differ. The processes most businesses utilize to pay other businesses involve more steps, more time, and, as we will touch later on, a higher share of cash/check which are much more manual payment mechanisms. B2B transactions often involve payments through multiple networks and currencies. In contrast, a C2B transaction may only occur in a few payment methods and likely one currency where the consumer is located. Contract terms for each B2B transaction may also vary depending on the significance of the customer or supplier but are very likely standardized for C2B transactions. The biggest differentiator is likely that multiple decision makers and checks/balances are in place for B2B transactions where a CFO, Controller, or Accounts Payable Clerk is eventually responsible for making approvals and payments. The average size of a transaction is much larger for B2B transactions, and B2B markets often involve a formal contract between two parties. Products are usually received first in B2B markets and then paid for, while it is often concurrent for most C2B transactions.
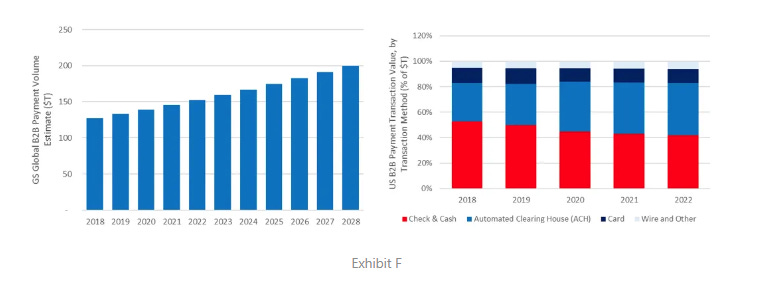
The B2B market where FleetCor participates is ~3-4x the size of C2B markets. MasterCard estimated the B2B market was $25T for North America and $125T globally in 2017-2018. This TAM isn’t necessarily entirely relevant to FLT, but I’ve shown in Exhibit F that a significant share of B2B payments are still being made by check & cash. The B2B market is still very check and cash-heavy because ~50% of transactions are invoiced on credit and business owners have historically been comfortable with these payment methods. There have been few catalysts outside of COVID-19 to accelerate this shift materially. SMB owners are also typically unaware of the hidden costs associated with these payment methods and have historically reinvested little into researching the market for better alternatives. Intelligence Insider data in Exhibit F shows that 43% of B2B payments are still made through cash and check and is well above the 19% percentage of the C2B market. Large businesses likely represent >50% of the payment flows. However, a big opportunity for payments companies remains with small businesses where >70% of invoices are manually processed and paid by many hand-signed checks.
Conclusion
FLT is a niche payments player with an effective capital allocator at the helm. I believe the company has cycled through the worst impacts of COVID-19, the FTC case and concerns about its longer-term positioning with its refreshed fuel/mobility offerings. I see good growth opportunities across the company’s portfolio, and through cross-selling solutions to its large customer base should be able to drive above-market-like growth for many years to come. I believe you could generate an ~15% IRR from the stock today. Alternatively, the stock trades at a 14.7x P/E, a discount to the 17.8x P/E it has traded at over the past five years, and the business should be able to compound earnings at least a low teens growth pace driving similar return expectations.
The Borlaug Report published another strong note, this time on Catalent (CTLT). Catalent is a CDMO that should benefit from secular growth in the biologics space. Here’s a brief portion of their excellent post. Be sure to read the whole thing here.
If you had to point to one thing that Catalent got right, it was identifying the value of biologics assets early. It acquired Cook Pharmica, a biologics fill-finish specialist, in 2017, and Paragon, a gene therapy business focused on process development and manufacturing solution, in 2019. Before this point, only 14% of the company’s sales were from biologics, and most of that was packaging. As of its latest fiscal year, over 50% of Catalent’s sales came from biologics.
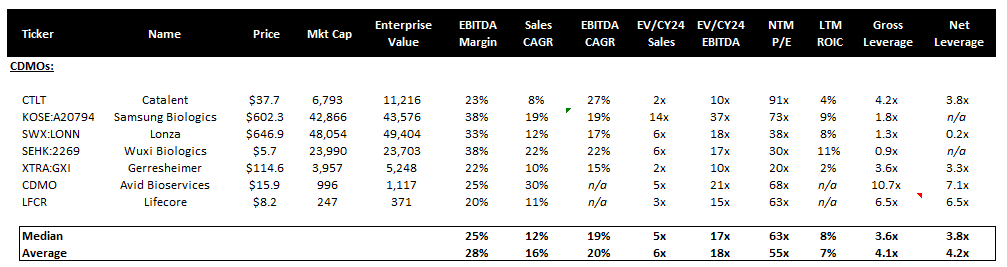
From a comps perspective, Catalent is among the cheapest in its group. Given the recent issues the company has faced lately, this is of little surprise (I’ll elaborate later).
Historically, CTLT’s EV/NTM EBITDA (below) looked like that of a boring industrials company until just before COVID. 10-15x was more the norm, vs the high-teens+ you see on most of the bigger ones today. This is probably due to its status as a cyclical stock, which is probably largely gone given how much of its mix is pharma-driven today. The little spike you see at the end is probably the huge downward EBTIDA revisions that recently took place.
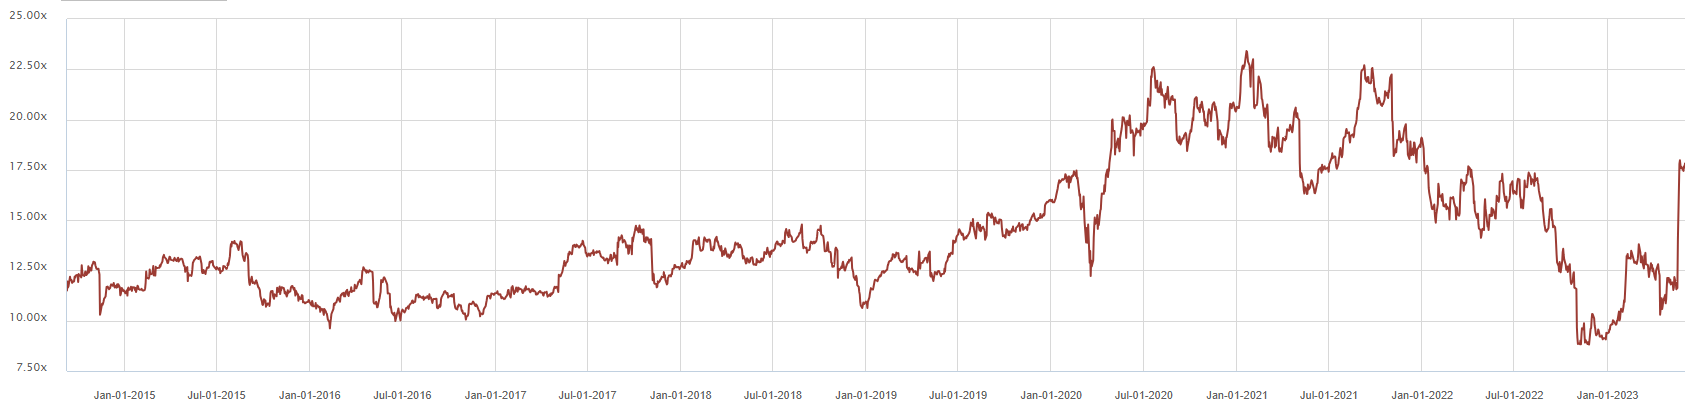
As for where Catalent SHOULD be trading, the multiple range seems to tell an obvious story. What you need to consider is what the forward numbers will look like, and how much variability there is in them. Consensus is assigning numbers between $800M to over $1B for Catalent’s EBITDA in FY24, a 25% step from low to high. So if you think Catalent’s multiple looks cheap at 11-12x FY24. Keep in mind that the mean CIQ estimate is $958M and the median is $910M just this difference almost makes a full-turn change in the multiple (~11.6x to 12.3x).
What Makes Catalent Interesting
From a macro perspective, I think one should consider ANY biologics-heavy CDMO for the following reasons:
There is a secular shift toward outsourcing due to new drugs coming from biotech startups (2/3s of the mix) and new drugs becoming increasingly biologic in nature (has already grown to half of pipeline assets, and is probably more than half of startup biotech pipeline assets).
The latter tailwind supports biologics as an industry growing 10-12%; the outsourcing layer can easily add another 3% to the high end of the range (which is reflected in a lot of industry growth estimates saying 10-15%).
The industry will grow, but not all players benefit equally - the larger companies have access to cash flow and financing that most smaller players struggle to get.
The larger players tend to enjoy a trusted status across all existing and new customers, because the only way a CDMO survives long enough to grow to large-cap status is with consistent execution on customer projects.
Revenues are more predictable relative to legacy CDMOs. Given the above industry tailwinds, and the supply/demand stuff I talked about in my last article, the demand is obviously present. Customers are often loyal as well.
Taken together, the industry has a steady stream of new customers locking themselves into their CDMO partners with loyalty and switching costs, and the ones that succeed become long-term partners.
As for Catalent specifically, it is interesting for the following
Reputation: Catalent is one of the “larger players” mentioned above, and has a wide array of loyal large pharma customers in its legacy segments as well as in its biologics fill-finish business. It was no surprise that it won a lot of COVID business. It is a destination of first resort for anyone trying to do most of the things Catalent does
Specialist in Gene Therapy: Gene therapy is the area that is the hardest to play in because of difficulties producing AAV, the most commonly-demanded type of gene therapy today. Given how inefficient it is to produce, it is also the most mismatched supply-demand category as well. This gives Catalent some pricing power which provides a lot of upside potential to some of the numbers I toss out later on.
Valuation: It is plain to see that Catalent’s valuation is at an optical discount today on forward EBITDA numbers. Catalent’s accounting and cost control woes, combined with the need to restate historical numbers, have placed it in the doghouse with many investors, which I think creates the opportunity.
The TLDR is that Catalent is quality service asset in an excellent industry suffering from superficial things that likely don’t affect the long-term value of the asset.
Until next time! - EP