


EP62: Raise The Roof
Stock Ideas From Investment Professionals

Welcome, subscribers! Today, we share lengthy pitches for a ceiling tile manufacturer, a retail facing foreign currency exchange, and a microcap SaaS-in-hiding.
Read on to learn more. 📕👇
Your support is appreciated. If you enjoy this issue, please forward to a friend or colleague!
Disclaimer: Nothing here constitutes professional and/or financial advice. You alone assume any risk with the use of any information contained herein. We may own positions in the securities listed. Please do your own due diligence.
To the investment managers who read this, you can send us your letters at elevatorpitches@substack.com or on Twitter (and Threads!) if you’d like to be included in a future issue.
Let’s get to it.
Recurve Capital recently published an informative look at Armstrong World Industries (AWI). Why does this manufacturer of ceiling tiles have such great pricing power?
AWI - Why do Ceiling Tiles Have Ferrari-like Margins?
This post will focus on a company with incredible pricing power: Armstrong World Industries (NYSE: AWI). AWI is the leading manufacturer of acoustical ceilings and walls in North America. Now established as the “Kleenex” of ceilings, the company’s history dates back more than 160 years, and it has evolved through many phases over time. In the last ten years, it spun off Flooring (AFI) from Ceilings and the successor AWI (Ceilings) sold off its European and Asian assets, focusing its operations on the Americas. The North American business always has been the crown jewel asset, with 60% incumbent market share and a go-to-market strategy that supports continued market share gains and some of the best pricing dynamics we’ve ever found.
Surely every reader has seen Armstrong’s (NYSE: AWI) products, but you may not have noticed them. Its most recognizable form factors are 2x2 square or 2x4 rectangle Mineral Fiber acoustical ceiling tile installed into a suspended steel ceiling. See below:
These look like commoditized products, but they perform quite differently. Although they are only about 3-5% of costs, ceilings are important for managing the acoustics of spaces which make them one of the most technically specified areas of a project. Ceilings can be specified with products that absorb, block and/or shape sound according to the space’s needs.
Before Covid disrupted construction activity and created price/cost distortions, AWI generated mid-40s EBITDA margins from these products. We would put AWI’s margins and pricing power against anyone’s. Let’s dive into pricing in more detail.
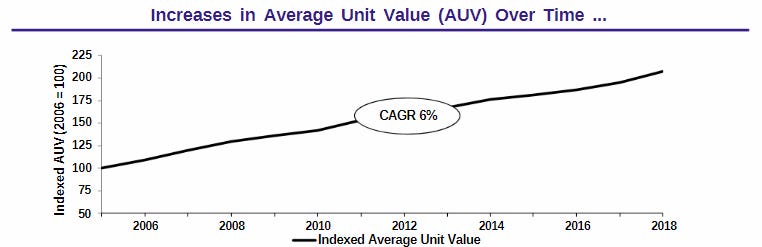
The chart below shows AWI’s average unit value (AUV) from 2005 to 2018, whereby pricing roughly doubled.
AWI always raises prices in excess of inflation, which makes the last 5 years more interesting. In a typical year, Armstrong raises prices twice: in February and in August. In years with abnormal cost inflation, the company makes adjustments as necessary to ensure its prices keep up, as we saw in 2021 and 2022. The chart below shows AWI’s methodical pricing adjustments during normal inflation periods (2019/2020), followed by more sizable adjustments in 2021, 2022, and 2023. It’s important to note that these are list prices, not fully realized prices (as are shown above). Typically, AWI recognizes about 30% of its price increases (e.g. if it raises prices 15% per year, it expects to land about 5% in realized price increases). Nonetheless, list pricing from year-end 2020 to Q3 2023 has about doubled, which means realized pricing has been about +30% - well above trendline.

The question we will explore in this post is: why does a product that looks like a cheap commodity enjoy Ferrari-like margins and some of the best pricing power we’ve ever found?
Spec, Track, and Close
Working backwards, Armstrong generates strong margins and pricing power because it has significant (~60%) market share, because it has tight control over its specifications and distribution, and because it operates in a duopoly-like market structure (USG is #2 with about 25-30% market share). With repairs and renovations comprising 70-80% of industry volumes, AWI’s incumbency advantage creates a recurring-like revenue stream that all distributors want. But how did the company get to this dominant position?
Armstrong’s go-to-market strategy was described to me by former employees as a three-step process called “Spec, Track, and Close.” We describe this process in more detail below:
1. Spec = Specification. AWI has a seasoned internal sales team that works with architects and designers to get its products specified into a project’s plans. As mentioned above, acoustical ceilings are low-value but high-impact to spaces and tend to be specified by product SKU. From our conversations with industry participants, once the specification is made, AWI retains that business about 85% of the time.
2. Ceilings are one of the last elements to be installed in a new building or major renovation project. AWI tracks all the projects in its specification pipeline and others under construction to ensure they are on top of any changes to the specifications and to enhance its visibility of when product should be ready to ship. Tracking is done via its in-house sales team and by monitoring developments among its exclusive metro-area distributors and with contractors to ensure they are following the specification.
3. Finally, AWI Closes on deals when its products are shipped to contractors, who then install them. Typically, AWI bundles its tile with steel grid provided by WAVE, AWI’s joint venture with Worthington. WAVE is one of the most successful joint ventures we’ve seen, but a topic for another day.
Importantly, AWI utilizes exclusive relationships with distributors in each metro area. Because of its high market share in the R&R market and its higher market share in new construction—powered by its innovative products and specification efforts—every distributor wants the Armstrong relationship. Once they have it, Armstrong enforces exclusivity, i.e. those distributors can only sell and distribute Armstrong’s products in its categories. If AWI catches a distributor selling other manufacturers’ products, they can and will swiftly move their relationship to another distributor, whose ceiling business would then experience significant growth by adding Armstrong. This structure creates significant incentives for AWI and distributors to work together in a stable and exclusive relationship so that each can maximize profits in the market by optimizing pricing and market share gains .
AWI’s two-tiered go-to-market strategy—using its internal teams and leveraging distributors—allows for a full-court press on the entire ecosystem, including architects, designers, and contractors, to ensure that Armstrong’s sales teams and its distributors originate and retain specifications, leading to significant market share for all construction projects. AWI’s competitors have not invested in all these elements of its go-to-market strategy, preferring instead (and we believe optimally) to ride on AWI’s pricing coattails to grow revenue and profitability rather than competing aggressively on price for a few points of market share - a dynamic in which everyone would lose. Even though AWI has about 60% market share already, we believe they are continuing to gain share from its product and technology innovation, both of which strengthen its competitive differentiation it in the market.
Growth Areas
Armstrong has invested in product R&D to improve acoustical performance, design elements (size, shape, color, etc.), sustainability metrics, and more. It’s also invested in front-end technology tools to help customers design their spaces and generate real-time, dynamic quotes as they make changes. Armstrong’s commitment to investing in new products and capabilities further separates it from other ceiling competitors. In fact, its product vitality index (share of products introduced in the last 5 years) has risen from <10% in 2012 to over 30% currently.
New products aren’t just good for market share – they’re also good for pricing. As discussed above, Armstrong always prices above inflation on a like-for-like basis, but it also generates weighted-average price increases from a long-term mix-shift to newer, higher end products. Historically, about half of AWI’s 6% CAGR in average unit value has come from like-for-like price increases and half has come from a mix benefit. In the post-Covid period, AWI has generated about a 6-7% CAGR in like-for-like pricing, but also has continued to benefit from favorable mix shifts, resulting in higher-than-normal AUV growth.
AWI also has been investing in a segment called Architectural Specialties. These are ceiling and wall installations made of wood, metal, felt, and other non-mineral fiber materials that are often more stylistic and which are highly specified – a natural fit for Armstrong’s go-to-market strategy. Spaces appropriate for Architectural Specialties were largely inaccessible to Armstrong’s core Mineral Fiber business. The image below shows one example of Armstrong’s many capabilities in this growth area. With a comprehensive portfolio of specialty substrates at its disposal, AWI leverages its ability to perform in these showcase spaces to get specifications across an entire project or building – including the areas requiring acoustical ceiling tiles.

To summarize, we believe AWI can price above inflation sustainably because:
1. It has the largest share of installed ceilings in a >70% replace/repair market.
2. It works tirelessly via its “Spec, Track and Close” process to win and retain specifications for its products into major construction projects.
3. It manages exclusive distribution agreements in almost all metro areas, reducing price competition in the market.
4. It invests in new product innovation and in technology tools to offer customers the best and highest-quality products and service in the industry, driving further share gains.
5. It leverages its Specialties business to access more areas of each building, and to increase its success in winning Mineral Fiber specifications in the same projects.
AWI’s entire focus is on highly specified ceiling and wall products that leverage its manufacturing, sales, and distribution infrastructure and processes that the company has developed over >100 years. Armstrong pursued its strategy while nurturing a duopoly-like industry structure that has fostered healthy pricing and margin dynamics.
How Did Inflation Impact AWI?
With Armstrong’s history of >20 years of ~6% AUV increases powered by its product innovation and its go-to-market strategies, it shouldn’t be surprising that the post-Covid bubble of inflation has increased our assessment of AWI’s long-term value. AWI gets to capture all the upside on pricing, but never gives that pricing back when its costs normalize.
To that point, below we show a chart that demonstrates these dynamics. The solid lines are actual and future price per unit and cost per unit trends from year 0 onward (in practical terms, we are in year 3). The dotted lines are the normalized trend lines for price and cost per unit, if inflation never occurred. We believe that in almost all reasonable cases, AWI’s year 5 and year 10 Gross Profit will be greater than the normalized, no-inflation scenario, due to its ability to extract strong like-for-like pricing during the inflationary period, creating a permanent and material step-up in price per unit, accompanied by a reversion to normalized cost curves over time.
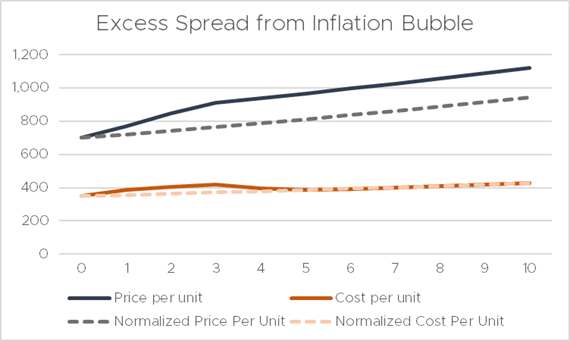
Even if cost inflation is stickier and more persistent going forward, we trust that AWI will adjust its pricing to create a similar price/cost spread expansion vs. the normalized path. AWI will almost always be better off because of inflation.
The primary swing variable for the magnitude of AWI’s absolute accretion to Gross Profit from inflation is its volume growth. In recent years, higher inflation and higher interest rates have suppressed construction activity and, subsequently, ceiling & wall industry volumes. If the industry and company can regain footing on volumes and recapture what was delayed or pushed out during the inflationary spike, we estimate that AWI stands to generate more than 20% Gross Profit accretion compared to its already healthy normalized outcome.
Summary and Closing
AWI has among the best control over its distribution and pricing dynamics that we’ve studied. Its ~60% market share comprised of 39 billion square feet of installed square feet, combined with its >70% replace & repair mix and its “Spec, Track and Close” strategies make AWI the preferred ceiling provider for every distributor, enabling exclusive relationships and healthy competitive and pricing dynamics across its industry.
While new construction and significant remodeling activity remain depressed and choppy due to high interest rates, we feel confident in Armstrong’s long-term growth formula, consisting of:
Low-single digit Mineral Fiber industry volume growth.
1-2% excess Mineral Fiber volume growth from AWI-specific product and technology initiatives.
Like-for-like pricing above inflation, as discussed above.
Positive mix shift toward newer, premium products.
In a normal environment, this growth formula should produce high-single digit/low-double digit revenue growth, expanding gross margins, and expanding EBITDA margins in Mineral Fiber. Additionally, AWI will continue to grow its less mature Architectural Specialties business, which generates incremental margins well above current profitability. Augmented by its share repurchase program, Armstrong has a nice path to generate >15% annual growth in EPS and free cash flow per share over a medium- to long-term horizon. However, we believe the current inflationary environment offers potential for results above these “normalized” expectations in the medium-term.
Plural Investing believes recent events at Currency Exchange International (CURN) have delayed - but not killed - the company’s international opportunity. They update their thoughts below.
Currency Exchange International (CXI.TO / CURN)
CXI is one of only three major suppliers of foreign banknotes in the United States and of US dollar banknotes internationally. Banknotes are typically used for travel and the Covid induced downturn masked major market share gains made by the company after its key competitor Travelex exited. CXI is run by Founder Randolph Pinna, who owns 21% of the company and has high integrity, delights customers, and a 35-year track record of building two banknotes businesses that have delivered strong shareholder returns. The company trades on 8x P/E today and we expect earnings to nearly double over the next three years. That puts the stock on just 4x our estimate of profits in three years’ time, net of cash generated in the interim. We started buying shares at US$14/shr in mid-2022, it trades at US$15/shr today, and we believe intrinsic value will be US$55/shr in three years. The stock ended Q3 down 24% from its peak earlier in the quarter.
As outlined in our last letter, we see two key opportunities for the company. Both of those disappointed investors in the quarter, but we expect that disappointment will be temporary.
We think CXI’s first opportunity is to grow outside the United States.
The company is one of only three licensed to supply dollar banknotes from the Federal Reserve to banks across the world, which is a market that we think is worth around $380mm in revenues. We expect CXI will take substantial share in this market, which is material versus the company’s total revenues of $77mm today.
Building out the international business has proved frustrating. While the company has signed on several major banks as potential customers, the US banking crisis earlier this year made these customers reluctant to rely directly on supply from a small company like CXI, even though CXI does not take deposits and does not carry traditional banking risk.
The company has only $130mm in assets, which means that if a customer like the Bank of Singapore makes a payment for $100mm of banknotes CXI’s assets would temporarily almost double until it shipped those banknotes.
CXI and its customers have found a solution, which is to use a major bank with hundreds of billions of assets to act as a middleman and guarantee transactions for a small fee.
We see this as a frustrating delay for a couple quarters and so while we were wrong in our timing, we have not changed our value of the company.
We think CXI’s second large opportunity is to use its cash.
The company holds $98mm in cash and $6mm in debt, a huge amount of net cash compared to its $95mm market cap. We estimate that $80mm of this cash needs to be held as physical banknotes so should be thought of as inventories, meaning excess cash that could be deployed is closer to $20mm. Still, investors are increasingly skeptical that this cash will ever be deployed as it appears to grow every quarter and management’s capital allocation plans could be clearer.
We have a different view. On the recent earnings call management stated that their most likely use of cash is to make acquisitions and that some incumbents in the banknotes market may want to exit.
We see this as a potentially excellent use of cash if the company remains disciplined in the price it pays. Virtually any merger of banknotes businesses would result in large synergies as much of the cost base - such as vaults, IT, and staff - does not have to be duplicated.
While management provided no further details on potential acquisition targets, there are only three other major companies in the industry: Bank of America, Wells Fargo, and Moneycorp. We view a deal with Moneycorp as unlikely as much of its business is in regions that CXI views as high risk. On the other hand, both Bank of America and Wells Fargo have downsized their business over time, which suggests they are willing sellers of some or all of those operations.
We believe that CXI’s roughly $80mm in banknote inventories could be financed with credit facilities at a conservative 0.5x loan-to-value. That financing would free up an additional $34mm beyond the $6mm in credit facilities that are already used. Combined with the company’s nearly $20mm in excess cash brings deployable cash for an acquisition above $50mm while still leaving a strong balance sheet with no debt beyond modest inventory financing.
A $50mm acquisition at CXI’s valuation of 8x P/E would (i) increase earnings by roughly 50% before synergies, (ii) demonstrate that the company’s cash is not 'trapped', and (iii) likely lead to a much higher multiple as investors start pricing in future cashflow being deployed in further high return acquisitions.
The company has yet to make acquisitions of this size and so some investors have concluded that it will never meaningfully use its cash. On the other hand, we believe that while having to wait is frustrating management fully intends to use its cash but that deals like this take time and they are keen to not overpay – an attitude that we support. Founder & CEO Randolph Pinna has been involved in several large M&A transactions in his career.
We expect that investors will greatly reappraise CXI’s intrinsic value over time as the business grows outside the US and management deploys cash. We also believe that the potential downside over a 3-5 year horizon is low if we are wrong given the company’s fortress balance sheet, 8x P/E valuation, and double-digit growth rate.
Deep Sail Capital initiated a new position in Creative Realities (CREX), a microcap provider of digital signage services. They walked through their thesis in their latest letter.
Current Position: Creative Realities (CREX)
Creative Realities is a digital signage installer and digital signage software operating system. Creative Realities has completed two major acquisitions since 2019 (Reflect Systems in 2022 and Allure in 2019) to build a digital signage software offering that includes a robust suite of software for managing digital signage. Creative Realities offers software solutions, including ReflectView for digital signage management, Clarity for digital menu board management, and Reflect AdLogic for managing advertising on digital signage. Creative Realities has historically only sold their software on screens that they install, but that is beginning to change. Due to the breadth and quality of their software offering, they are beginning to ramp up a channel sales program to allow other digital signage installers to offer their software. This will likely begin as a very small opportunity for Creative Realities, but the gross margins on their software sales (likely ~70–80 margins) are much higher than their core hardware sales (~40%), so from a business model perspective, it could be transformative.
The current SaaS business is operating at an annual recurring revenue (ARR) of $15.2 million as per the Q2 earnings report, which has been steadily growing over the past few quarters. As they install new sites, their software ARR will continue to grow, with around 5% of the spend from installation converting into increasing software ARR. If they can deliver $120 million of backlog installations over the next two years, their ARR should be over $20 million per year at the end of the period. Outside of the normal ARR from software operating licenses, they have several areas in which they can expand their ARPU per installed display, including content design, ad delivery, and interactive functionality.
Market Opportunity - Segments
Creative Realities operates in two segments: hardware sales and services and software. Hardware sales include all of the display sales and installation costs associated with installing new digital displays. Services and software sales include engineering, design, content, ad exchange fees, and software licenses via a SaaS model. The hardware business is largely a commodity business, as they are simply resellers and installers of the OEM’s hardware. The services and software business is the higher margin portion of the business, which is where the company is planning to gain leverage in their business model. The entire services and software business operates at a 60% gross margin, but we estimate that the SaaS portion of this business operates at a very high gross margin of 70–80%.
The space for digital signage is a highly competitive business, but within each category, the competition differs. For example, in digital menu signage, Creative Realities competes largely with smaller local or regional digital signage installers, but in retail or entertainment signage, they compete with larger competitors like Stratacache and MagicInfo. Creative Realities is a top 10 digital signage installer (7th by licenses) based on industry research the company provides from the Invidis 2023 Yearbook. The company’s offering has all the elements of a complete offering, including installation, design, operating software, and an advertising platform. Their complete solution has contributed to significant customer wins in the last 24 months. In 2022 and 2023, the company won three major customers: Panera Bread, Starlight Media, and Strike Ten Bowling/Bowling Proprietors Association of America (BPAA). These deals are a significant win for the company and highlight their total offering strength. In terms of the number of digital displays for each win, Panera is forecast at 2,000 sites, Starlight Media is forecast at up to 6,000 media assets, and the Bowling deal will evolve over time, but expectations are at least 250–500 sites. These three larger deals will be delivered over the course of the next few years, with the bowling delivery just starting in October of this year after a significant delay due to third-party equipment delays. The current backlog of the company is $120 million, which they believe they can deliver on over the next two years.
Recent history: Merger, Buyout offer, and Equity Raise
2022 and 2023 has been a very eventful two years for Creative Realities. Here is a quick summary:
February 2022: The company completed an acquisition through a merger with Reflect Systems, which brought together their current software offering. The purchase price for the Reflect acquisition was $35 million, which was paid for via a mix of cash (raised via equity issuance prior to closing) and equity in Creative Realities.
January 2023: Creative Realities was forced into a 3 for 1 reverse stock split in order to meet the Nasdaq minimum bid price requirements.
February 2023: The existing largest shareholder of the company’s equity, Pegasus Capital Advisors, sent the company an unsolicited bid for the company at $2.43 per share.
March 2023: The Creative Realities board rejects Pegasus Capital’s first unsolicited bid at $2.43 per share as they believe it underprices the current backlog and coming revenue and free cash flow ramp from the recent major customer wins. The company increased revenue guidance for 2023 to exceed $60 million.
May 2023: The Creative Realities board rejects Pegasus Capitals second unsolicited bid at $2.85 per share.
August 2023: Pegasus refuses to re-negotiate a ~$7 million amortizing note. Creative Realities, seeking to secure all needed cash until they turn the corner to FCF-positive, raised cash from selling 3 million shares at $2 per share.
October 2023: Shares trade down to their lowest level ever of $1.35. Creative Realities confirms revenue will be within guidance for Q3 2023 and reiterates their $60–80 million revenue guidance for the next 12 months. Shares trade up to $1.75.

Conclusion
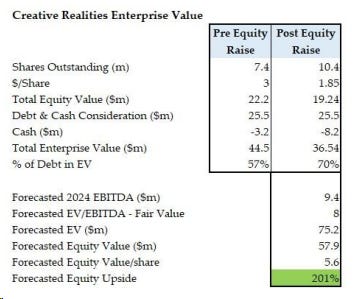
Creative Realities is a unique situation in which the company has built a solid platform for their industry vertical and sold that offering to major customers. All that is waiting for the company now is to execute on those sales, which are largely based on them getting access to sites and availability of third-party equipment. The stock is extremely cheap at this level, trading at 4.4x EV/NTM EBITDA estimates. The company has a sizable portion of their EV in debt, providing the equity significant upside if they can deliver.
We currently believe the business is worth $5.6 per share or a 201% upside to the current market price of $1.85 per share, which rests purely on them delivering on already sold projects and considers no new major sales wins or the potential to expand their software business through channel partnerships.
Until next time! - EP